

According to Google's Chief Economist, Dr. Hal Varian, "The ability to take data—to be able to understand...

FP&A Data Visualisation: Does Your Graph Actually WORK?
October 7, 2017
The graph is the right way to present your FP&A information. The important question is:
What changes and additions to the graph will help your audience understand its central messages quickly and accurately? Will visual effects that “beautify” the graph help or hurt that objective?
Remember why you’re creating a graph in the first place: to enable your audience to grasp an important point quickly and effectively. With that in mind, consider the following graphs, which I found when googling “U.S. trade balance for 2016”:
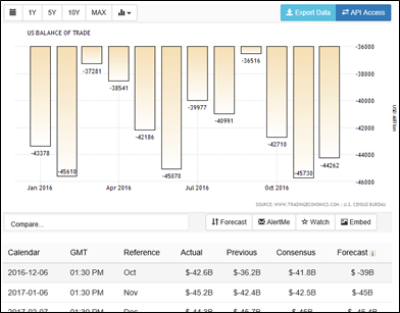
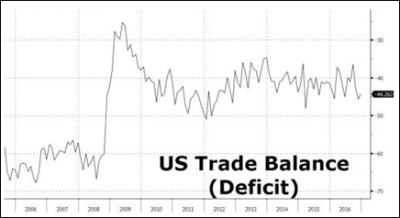
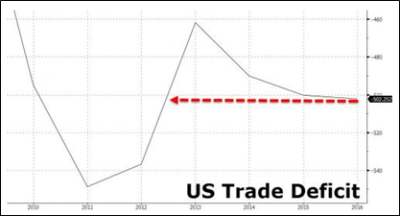
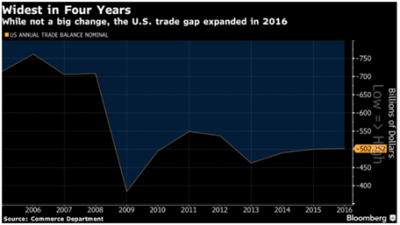
Each of these graphs was on the first page of Google hits, so they came from large websites with access to plenty of FP&A talent. Now look at each of these graphs and ask yourself questions ranging from the picky to the metaphysical, such as:
- Can you quickly understand the graph is about?
- Can you read the numbers and other print?
- Do you have a good sense of the magnitude of the period-to-period differences?
- Does the graph illustrate a clear trend or pattern? Does it tell a story?
- The last of the four graphs makes the most extensive use of colors and other text effects. Does all that make the graph easier or harder to read?
All in all, I was unimpressed. Almost every FP&A professional has at least one college degree, and yet so often we forget the fundamentals of clear communication. Here are just a few of the graphing principles you should always keep in mind:
- The print should be large enough to read.
- Include clear, correct titles and other explanatory information.
- Use intelligent axis scaling, tick marks, gridlines, data labels, and other visual aids to enable readers to understand the numbers with the appropriate level of precision.
- If the variable being graphed has a “natural zero,” the axis scale should include zero.
- But make sure that the abovementioned “visual aids” don’t stand out more strongly than the data you’re trying to present. (Or, as Edward Tufte has put it, you want to maximize the data-ink ratio.)
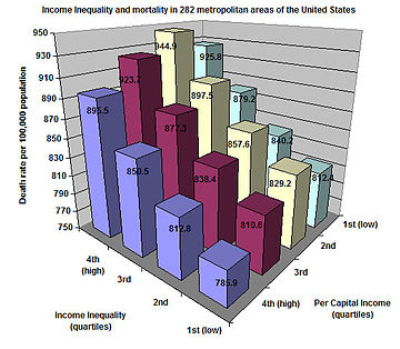
That last point deserves special mention because today’s graphing software lets you really cut loose with visual effects. For example, do three-dimensional graphs – like the one below – really make information easier to understand, or do they just look glitzy?
Another example comes from a major stockbroker’s mobile app, showing the day’s movement of three major U.S. stock indices. Here’s what you might want to learn from this infographic (perhaps you’ll add one or two points of your own):
- Is the market up or down today?
- Is today’s market movement – whether up or down – large or small?
- How is each index moving, compared to the other two?
Now, cover the bottom half of the image, and look only at the graph:
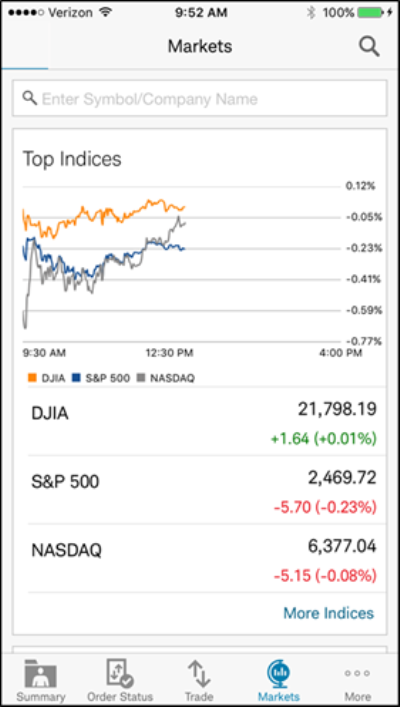
Were our questions answered? Well, the absence of a clearly marked zero line on the vertical axis scale makes it hard to tell whether the indices are above or below their previous day’s closes. The choice of scaling that axis so that the graph lines fill the chart area from top to bottom makes it impossible to tell whether the market moves are large or small. And the use of non-intuitive distances between gridlines (0.18% on this one, rather than, say, 0.1% or 0.2%) contributes to both problems. Lastly, there are more effective ways of helping the reader associate each graph line with that index’s name than the tiny legend at the bottom of the chart area.
Frankly, the most valuable information is the little table comprising the bottom half of the screen. In fact, all I learn from the graph is whether the market went up or down during the day. This image comes from a company that spends millions on customer communications; they can do better. As an FP&A professional, what are the stakes for you personally when you’re designing your reports?
In this blog, we focused primarily on was how hard it is to make graphs instantly understandable, and how often we fail to achieve that – a problem that dogs expensively-produced infographics and not just our day-to-day FP&A work. We barely focused on the things you should do. That’s a long and very detailed topic, and there are several excellent references. In addition to my own book, Painting with Numbers, I strongly recommend Storytelling with Data, by Cole Nussbaumer Knaflic; Show Me the Numbers, by Steven Few; and of course any of the several works by Edward Tufte.
The article was first published in prevero Blog
The full text is available for registered users. Please register to view the rest of the article.
Related articles

The link to strategic planning becomes evident when FP&A is placed within this bigger picture. By...

“A good sketch is better than a long speech…” a quote often attributed to...
+
Subscribe to
FP&A Trends Digest
We will regularly update you on the latest trends and developments in FP&A. Take the opportunity to have articles written by finance thought leaders delivered directly to your inbox; watch compelling webinars; connect with like-minded professionals; and become a part of our global community.