SWTCH by Pigment
Three days of predictions, insights, and advice from leaders in finance, sales, HR, supply chain and more
Register now here

SWTCH by Pigment
Three days of predictions, insights, and advice from leaders in finance, sales, HR, supply chain and more
Register now here
![]() For organizations with annual expense budgets, it is important to have procedures for monitoring expenditures and budget items throughout the year. It is particularly useful to have a procedure for estimating early in the year what the actual end-of-year expenditures are likely to be for various components of the budget. This allows for corrective action to be taken where necessary. It is also helpful if the estimation procedure is straightforward and systematic.
For organizations with annual expense budgets, it is important to have procedures for monitoring expenditures and budget items throughout the year. It is particularly useful to have a procedure for estimating early in the year what the actual end-of-year expenditures are likely to be for various components of the budget. This allows for corrective action to be taken where necessary. It is also helpful if the estimation procedure is straightforward and systematic.
We can use simple predictive visualization techniques and exploratory data analytic methods to extrapolate expected expenditures as a function of spending year-to-date and historical spending patterns. This approach is based on the assumption that historical spending patterns remain relatively similar over time. We have observed this to be the case in different organizations in a corporation and medical departments in hospitals. Thus, future spending patterns may be predictable from past historical patterns.
Historical patterns of spending are determined by dividing the year-end expenditures into year-to-date expenditures for all months to derive cumulative proportions for year-end spending for all months in the year. The deviations from the cumulative monthly average of these cumulative proportions are then plotted to display the yearly spending patterns. See the real data examples below.
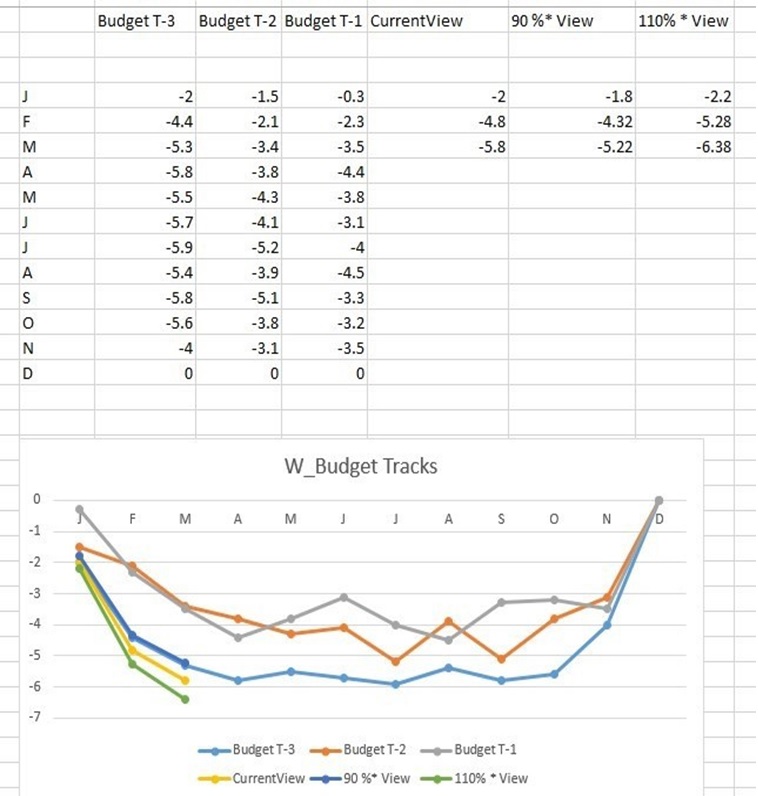
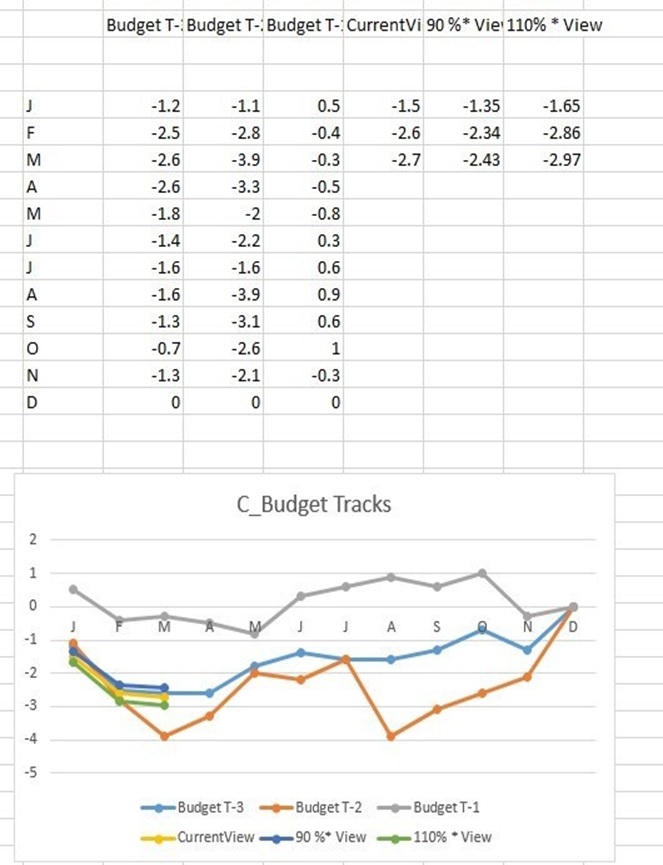
Real Data Examples. The data tables show the % of Total Budget (View) minus % of Year elapsed. Each month is taken as 1/12 of the annual Total. Upon further analysis and review, it might help to do better-weighted allocations.
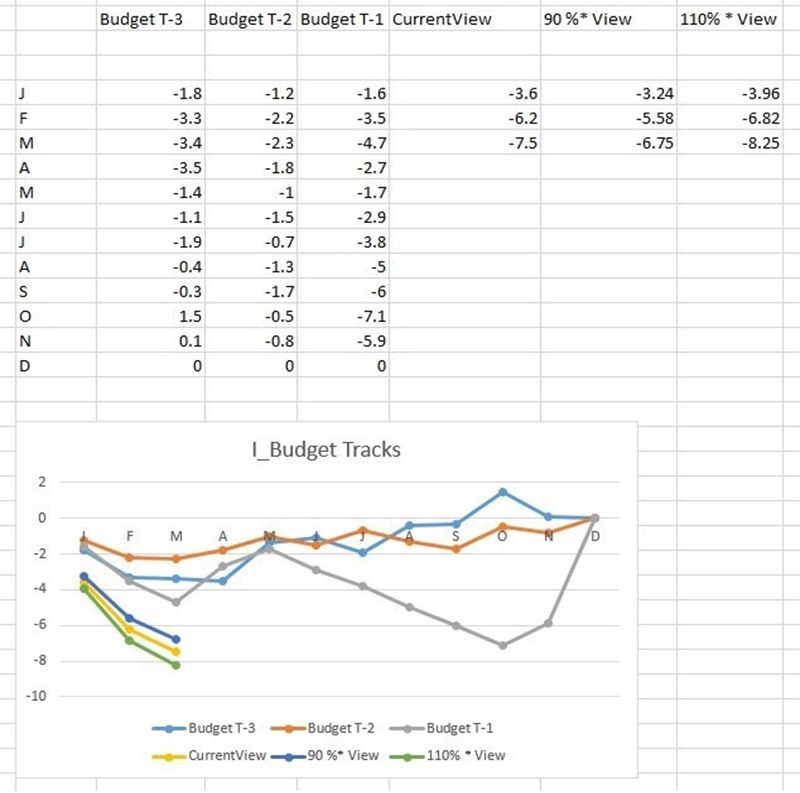
With a predictive visualization of three months of actual outcomes displayed in the current year, you can see how the “pattern of drift” away and recovery has behaved for the previous three years. One way to summarize these is to say that W_Budget and C_Budget would come close to the View if they followed respective Budget T-3 patterns, but that I_Budget will have to do something quite new to get to the View.
We make the following judgments based on the first three months of the current year’s data. It appears that
BUT, It also appears that I_Budget is headed for perhaps 70% of View.
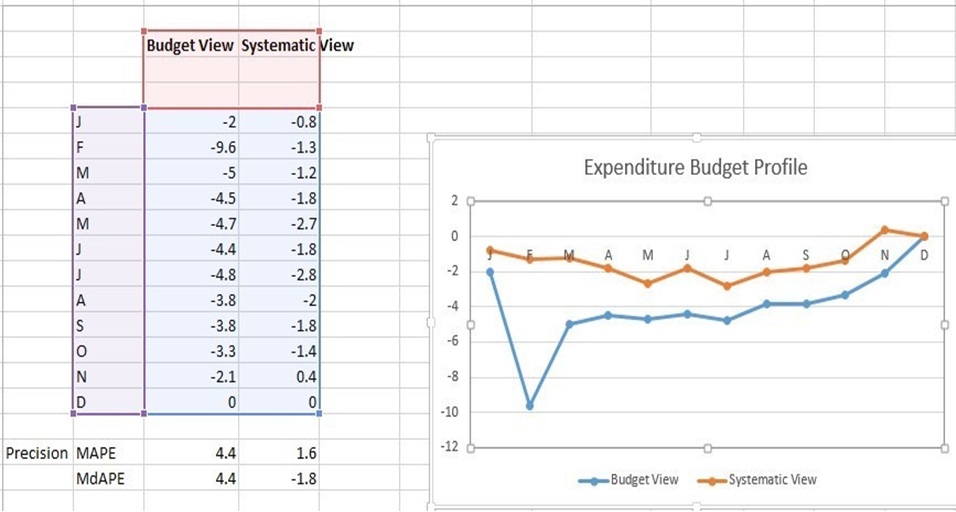
Once three or more years of monthly (or quarterly) budget patterns have been observed, you can begin to monitor current budgets with rolling forecast profiles using statistical forecasting models. Statistical forecasting models not only provide forward-looking budget patterns (forecast profiles) but can also establish uncertainty ranges on the projections. Using well-documented, valid and objective state space forecasting models, you can create credible “budget profiles” and ranges for tracking year-to-date budgets. The Budget View are the percentage difference between actual monthly expenditures. The Systematic View is the percentage differences between model projections and the actual monthly expenditures. The 12-month Views were created before the actual expenditures were booked. In this example, we might say that:

Considering forecasting as an exercise to assess future financial performance as accurately as possible through a...

Many businesses have yet to discover the full benefits of evolving their planning process to include...

In an uncertain and fast-changing world, line managers need to be made aware of the uncertainties...
We will regularly update you on the latest trends and developments in FP&A. Take the opportunity to have articles written by finance thought leaders delivered directly to your inbox; watch compelling webinars; connect with like-minded professionals; and become a part of our global community.